
1. Background
In China's energy consumption, industrial enterprises are the main group of energy consumption, accounting for about 70% of the total energy consumption of the country. The traditional way of measuring the energy consumption of various factories has resulted in incomplete, inaccurate and incomplete energy consumption data, which makes it impossible to analyze and diagnose energy consumption, resulting in incomplete measurement, inadequate management and high energy consumption, There is no effective means to control the energy consumption of various equipment, so there is a waste of energy.
A production enterprise in Henan consumes a large amount of energy every year, but there is no perfect management system. It wants to establish an energy consumption management system to realize the informatization and scientific management of the whole process from energy data collection to process monitoring to energy consumption management, so as to achieve the goal of energy conservation and consumption reduction and improve the overall energy management level. Our company has created a set of energy consumption management cloud platform system integrating data collection, key node monitoring, data analysis and statistics. The system helps the enterprise solve the problems of serious energy consumption, high production cost and low management level, so that the factory can find out high energy consumption nodes or unreasonable energy consumption habits through refined management, provide accurate data support for users to further energy-saving transformation or equipment upgrading, and greatly improve the company's management level.
2. System architecture
Industrial energy consumption management system hardware adopts the following three methods:
Meter acquisition
(1) Hardware equipment: smart electricity meter, 4G terminal gateway;
(2) Working principle: the intelligent electricity meter collects the voltage, current and electricity value of the machine equipment in real time, and sends the data to the server platform for data processing and analysis through the 4G terminal gateway after edge processing, so as to realize the real-time monitoring of the equipment electricity;
(3) Installation method: replace the original local electricity meter with a smart electricity meter to provide 220V power supply.
PLC data acquisition
(1) Hardware equipment: 4G terminal gateway (data acquisition gateway);
(2) Working principle: Collect the power of PLC equipment or sensor equipment of the original equipment through 485/RJ48 network port, and send the voltage, current, power and other parameters of the local equipment to the background through 4G terminal gateway for processing, so as to realize the energy consumption management of the local equipment;
(3) Installation method: add 4G gateway to the 485 port or PLC network port of the original machine, and provide 220V power supply.
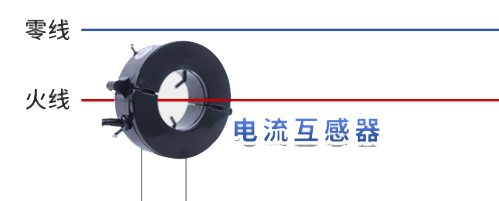
Transformer acquisition
(1) Hardware equipment: transformer, 4G terminal gateway;
(2) Working principle: read the voltage and current values of the wire through the transformer and send them to the background through the 4G terminal gateway for processing, so as to realize the energy consumption management of the local machine;
(3) Installation method: the line does not need to be modified, and the transformer is installed to detect and provide 220V power supply.

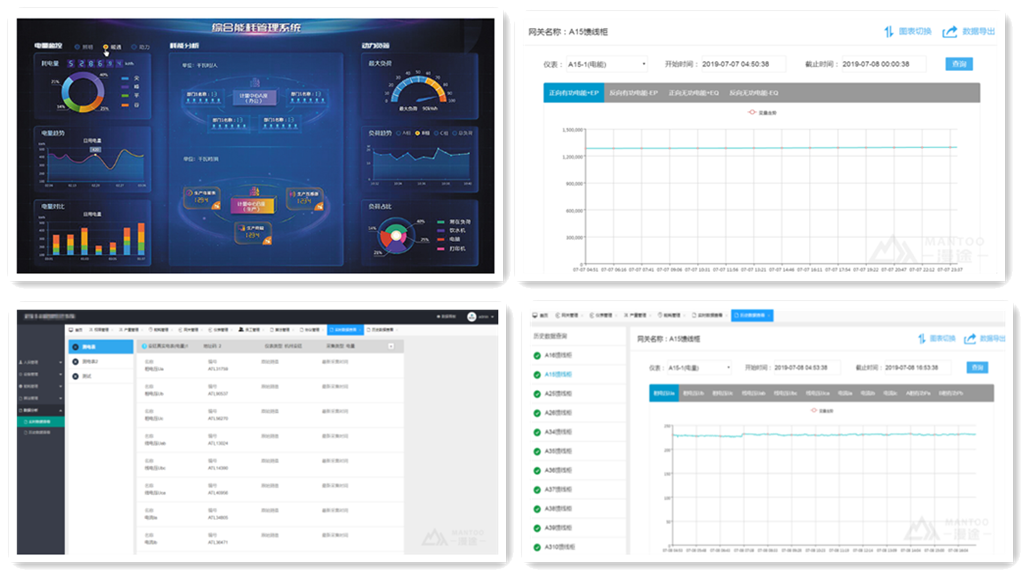
3. System functions
Real time data: online detection of equipment energy consumption, real-time online monitoring and display of equipment current, voltage and power values;
Equipment management: support the addition, modification and deletion of information of electricity meter and gateway equipment;
Remote control: remotely control the power on and off of each branch in the power distribution cabinet, and trip and remote closing;
Energy efficiency analysis: analyze the power consumption of each equipment by year, month, day and hour, analyze the production chart, and clearly view the power consumption analysis of each equipment;
Visualization board: according to the real-time collection of electricity, the curve chart of the time period and 3D pie chart of each equipment are formed, and the alarm data is refreshed in real time;
Historical report: support the viewing of historical data collected by various meters, and support the export and backup of historical data;
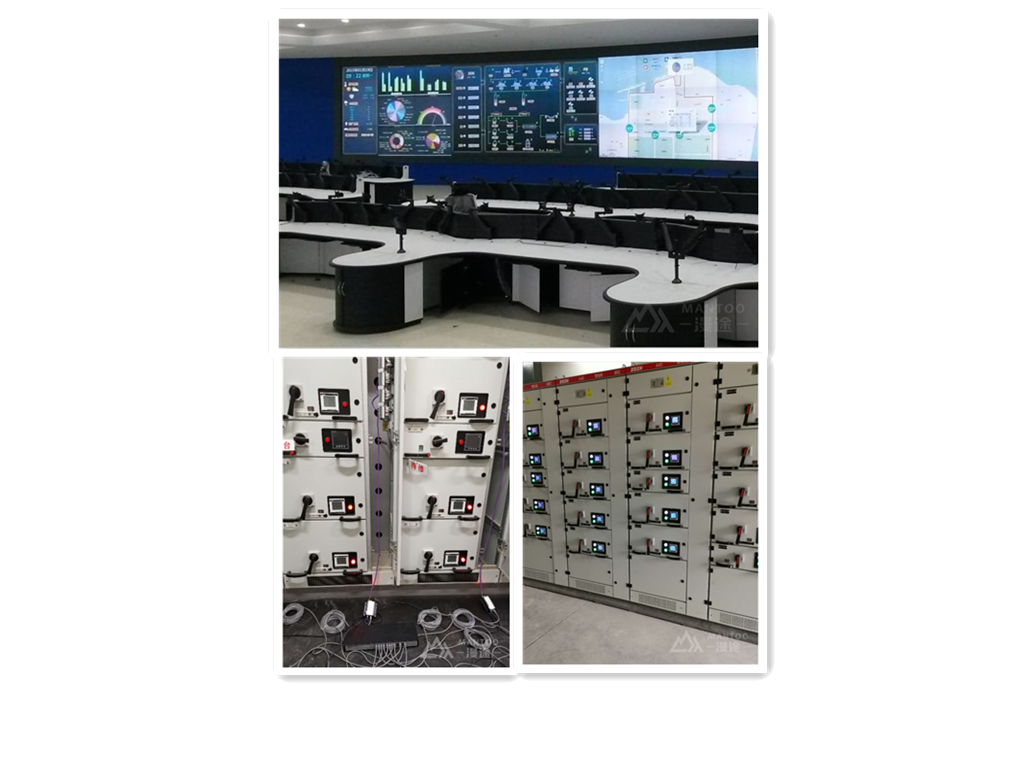
4. Case site
hotline:400-6822950
Email:service@mantoo.com.cn